

How to Use ChatGPT and Google Sheets to Create a Simple Sales Forecast in 2026
Sales can feel unpredictable when you run a small business. One month looks strong, the next month is slower, and it is hard to know whether you should hire, buy inventory, increase ad spend, or hold onto cash. At the same time, expensive forecasting software may be too much for a solo operator, consultant, local service business, or small team.
That is where using ChatGPT and Google Sheets to create a simple sales forecast can help. Google Sheets gives you a familiar place to organize sales data. ChatGPT can help you structure the spreadsheet, write formulas, spot unusual months, and explain the forecast in plain English.
This article is not certified financial advice. It is a practical planning workflow for business owners who want a clearer view of the next few months without building a complex financial model.
TL;DR: Simple Sales Forecast Workflow
- Use Google Sheets to organize monthly sales history, assumptions, and forecast scenarios.
- Use ChatGPT to review your sheet structure, suggest formulas, and explain trends.
- Start with 6 to 12 months of clean revenue data; 12 to 36 months is better.
- Create conservative, baseline, and optimistic forecast columns.
- Review the forecast monthly and compare actual revenue against projected revenue.
- Upgrade to automation or dedicated forecasting software only when the spreadsheet becomes too manual or fragile.
Why Small Businesses Need a Simple Sales Forecast in 2026
A sales forecast is an estimate of future sales based on historical revenue, current pipeline, expected growth, seasonality, and business assumptions. It does not need to predict the future perfectly to be useful. For many small businesses, the real value is forcing the owner or leadership team to think clearly about what might happen next.
A simple forecast can help answer practical questions such as:
- Can we afford to hire another employee next quarter?
- Should we increase ad spend or wait until cash flow improves?
- Do we need to order more inventory before a seasonal rush?
- Are we relying too heavily on one large client or one-time contract?
- What happens if our close rate drops or lead volume slows down?
For example, a service business might forecast monthly revenue using three inputs: number of leads, close rate, and average project value. If the business expects 40 leads next month, closes 25 percent of them, and earns an average of $3,500 per project, the rough forecast is:
40 leads x 25% close rate x $3,500 average project value = $35,000 forecast revenue
That number is not guaranteed. But it gives the owner a starting point for decisions about staffing, scheduling, cash reserves, and marketing.
Who This ChatGPT and Google Sheets Forecast Is For
This workflow is best for business owners and small teams that need a practical planning tool, not a full investor-grade financial model.
Best Fit
- Solo operators
- Freelancers
- Consultants
- Small agencies
- Local service businesses
- Small ecommerce teams
- 5-50 person companies with basic sales tracking
It works especially well if you already track sales data in Google Sheets, QuickBooks exports, Stripe reports, Shopify reports, CRM exports, invoice records, or deal spreadsheets.
When It Works Best
This approach is most useful when the business has at least 6 to 12 months of monthly sales history or a clear sales pipeline. If you have 12 to 36 months of history, you can often spot seasonal patterns more easily, such as strong fourth quarters, summer slowdowns, or recurring renewal months.
When It Is Not the Right Tool
This setup is not ideal for businesses that need investor-grade financial models, complex inventory planning, advanced cash flow modeling, or governed enterprise forecasting. If multiple departments depend on the forecast, or if the forecast must connect directly to CRM, accounting, and operations systems, you may eventually need a dedicated forecasting platform or custom dashboard.
Rough Cost
Google Sheets is free with a Google account. ChatGPT has free and paid plans. Free plans may be enough for basic prompting, while paid plans are typically better for longer analysis, file work, and more involved spreadsheet help. Pricing and availability can change, so check current plan details before building a workflow around a specific feature.
What Data to Put in Google Sheets Before Asking ChatGPT
ChatGPT is most useful when your data is organized clearly. Before asking it to create formulas or projections, set up your spreadsheet so the structure is easy to understand.
Create a Historical Sales Tab
Create a tab called Historical Sales. Use simple column labels like these:
- Month
- Revenue
- Units Sold
- Number of Deals
- Average Order Value
- Notes
Use plain month labels such as Jan 2025, Feb 2025, and Mar 2025. Avoid merged cells, decorative formatting, and inconsistent column names. Those design choices may look fine to a person, but they make analysis harder.
Add Clean Monthly Data
Add at least 6 months of data. If you have 12 to 36 months, use it. More history can help ChatGPT and your formulas identify patterns, but only if the data is reasonably clean.
Use the Notes column to flag unusual months. Examples include:
- A large one-time contract
- A website outage
- A holiday rush
- A price increase
- A major client cancellation
- A temporary ad campaign
- A supply shortage
Those notes matter because a forecast should not blindly treat every historical month as normal.
Create an Assumptions Tab
Create a second tab called Assumptions. This is where you list the business expectations that shape the forecast.
Useful assumptions include:
- Expected annual growth rate
- Expected monthly lead volume
- Close rate
- Average deal size
- Known seasonal adjustments
- Planned price increases
- Expected marketing budget changes
- Known customer churn or renewal patterns
Do not hide these assumptions. In many small business forecasts, the assumptions are more important than the formula. A spreadsheet that shows the assumptions clearly is easier to review, challenge, and improve.
Step-by-Step: Build the Forecast With ChatGPT and Google Sheets
Here is a practical workflow for using ChatGPT and Google Sheets to create a simple sales forecast.
Step 1: Organize Historical Sales Data in Google Sheets
Start with a clean table in your Historical Sales tab. Each row should represent one month. Each column should have one clear purpose. Do not mix notes, formulas, and revenue values in the same cell.
A basic table might look like this:
| Month | Revenue | Units Sold | Number of Deals | Average Order Value | Notes |
|---|---|---|---|---|---|
| Jan 2025 | $42,000 | 120 | 18 | $2,333 | Normal month |
| Feb 2025 | $39,500 | 114 | 17 | $2,324 | Short month |
| Mar 2025 | $51,000 | 138 | 22 | $2,318 | New ad campaign |
Step 2: Open ChatGPT
You can use ChatGPT in the browser by copying data or uploading a file if your plan supports it. Some accounts may also have access to ChatGPT features or integrations that work directly with Google Sheets. Availability can vary by account and plan, so treat direct spreadsheet integration as useful when available, not required.
If you are using ChatGPT inside or alongside Google Sheets, make sure it is looking at the correct sheet or data range before asking it to create formulas.
Step 3: Ask ChatGPT to Review the Sheet Structure
Before creating a forecast, ask ChatGPT to inspect the table structure. This helps catch missing fields, unclear labels, and data issues early.
Example prompt:
“Review this Google Sheets sales data and tell me what columns are missing before I create a 12-month sales forecast. The goal is to forecast monthly revenue for a small service business.”
Step 4: Ask for a 12-Month Forecast
Once the structure is clean, ask ChatGPT to create a 12-month forecast using historical revenue, seasonal notes, and a conservative growth assumption.
For a first version, keep the request simple. A small business owner usually gets more value from a clear forecast that is reviewed monthly than from a complicated model that nobody maintains.
Step 5: Create Conservative, Baseline, and Optimistic Scenarios
Scenario planning helps you avoid treating one projection as certain. Create three forecast columns:
- Conservative: little or no growth
- Baseline: realistic expected growth
- Optimistic: stronger growth if marketing, pipeline, or demand improves
For example, you might use 0 percent, 5 percent, and 12 percent annual growth assumptions.
Step 6: Add a Summary Tab
Create a third tab called Summary. Include monthly forecast revenue, estimated expenses, and expected cash gap or surplus.
A simple summary table might include:
- Month
- Forecast Revenue
- Estimated Expenses
- Expected Cash Surplus or Gap
- Owner Notes
This turns the forecast from an abstract revenue estimate into a decision-making tool.
Step 7: Add a Line Chart
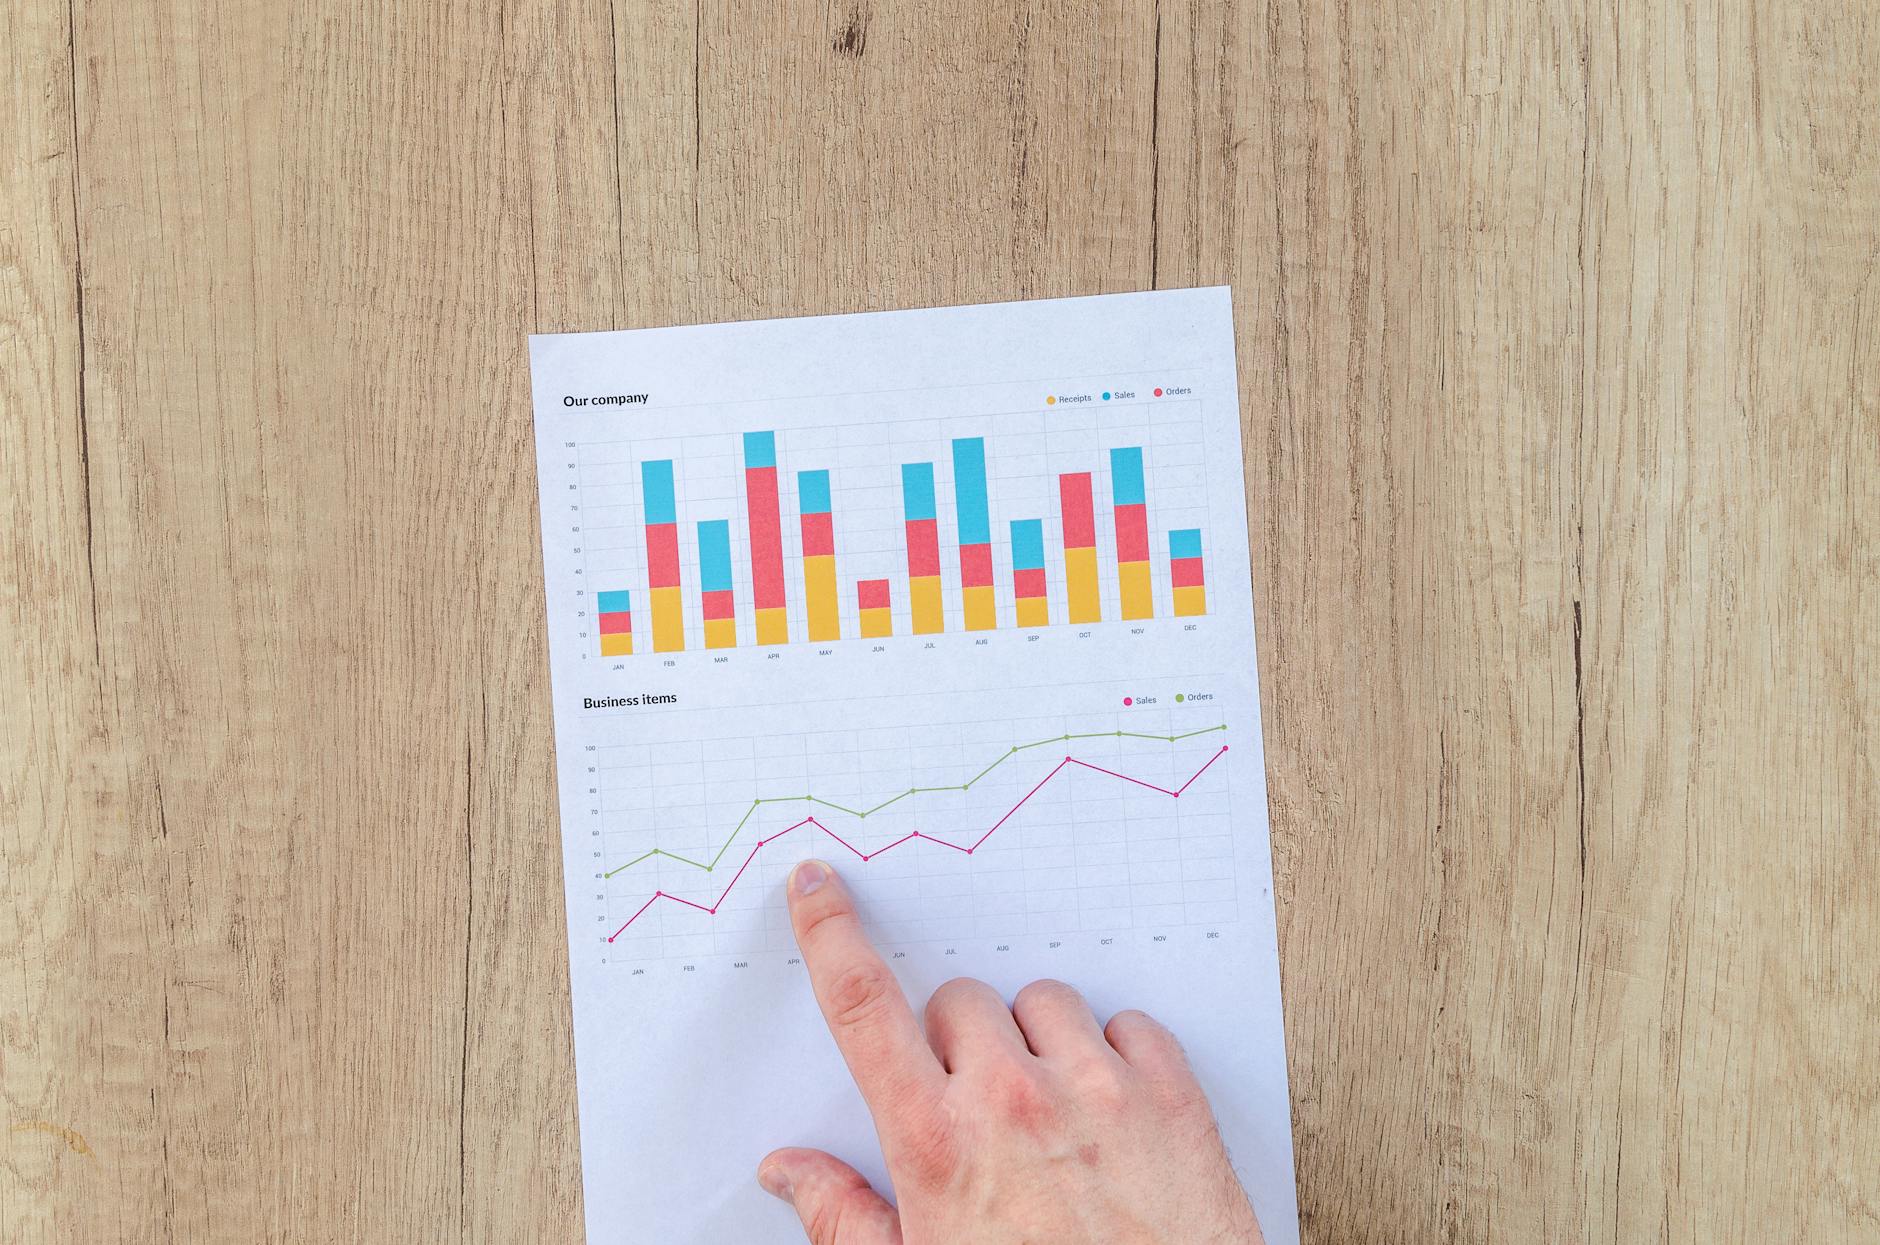
Create a simple line chart comparing actual sales against forecasted sales. Use separate lines for actual revenue, baseline forecast, conservative forecast, and optimistic forecast.
The chart makes it easier to spot whether the business is tracking ahead of plan, behind plan, or within the expected range.
Copy-and-Paste ChatGPT Prompts for a Sales Forecast
Use these prompts as starting points. Replace the details with your business type, forecast goal, and assumptions.
Prompt 1: Review the Data
“Review this Google Sheets sales data and tell me what columns are missing before I create a forecast. I want to forecast monthly revenue for the next 12 months. Point out any data quality issues, unusual months, or missing assumptions.”
Prompt 2: Create a 12-Month Forecast
“Create a 12-month sales forecast using this monthly revenue history, a 5 percent baseline annual growth rate, and any visible seasonal patterns. Explain the method in plain English for a non-technical business owner.”
Prompt 3: Add Scenarios
“Add conservative, baseline, and optimistic scenarios using 0 percent, 5 percent, and 12 percent annual growth assumptions. Show the monthly forecast revenue for each scenario.”
Prompt 4: Generate Google Sheets Formulas
“Give me Google Sheets formulas I can paste into row 2 and drag down for monthly revenue forecasts. Use columns for Month, Actual Revenue, Baseline Forecast, Conservative Forecast, Optimistic Forecast, and Notes.”
Prompt 5: Identify Unusual Months
“Identify any months that look unusual in this sales data. For each unusual month, explain whether it should be excluded, adjusted, or simply noted in the forecast.”
Prompt 6: Summarize for Business Decisions
“Summarize this forecast in plain English for a business owner deciding whether to hire, increase ad spend, or hold cash. Include the main risks and the assumptions that matter most.”
Simple Forecasting Formulas to Use in Google Sheets
ChatGPT can help write formulas, but you should understand what the formulas are doing. Here are several simple options.
Use AVERAGE for a Basic Monthly Run Rate
If sales are fairly stable, you can use recent average revenue as a basic run rate.
=AVERAGE(B2:B13)
This formula averages revenue from the last 12 months if your revenue is in column B. It is simple, but it may miss growth trends or seasonality.
Use FORECAST.LINEAR for a Simple Trend
If revenue is steadily increasing or decreasing, a trend-based formula may be useful.
=FORECAST.LINEAR(A14,$B$2:$B$13,$A$2:$A$13)
This estimates a future value based on the relationship between prior dates and prior revenue. It works best when the historical pattern is reasonably consistent.
Use GROWTH for Growth-Based Projection
The GROWTH function can be useful when sales appear to grow at a compounding rate. It is not always appropriate for small or uneven datasets, so review the output carefully.
=GROWTH($B$2:$B$13,$A$2:$A$13,A14)
Use Manual Seasonality Adjustments
Sometimes the best small business forecast uses simple manual adjustments. For example, a retail business with a strong December may multiply December revenue by 1.2 to reflect a holiday-heavy month.
=BaselineForecast*1.2
For a summer slowdown, you might use:
=BaselineForecast*0.85
The key is to document why the adjustment exists.
Use Scenario Columns
A practical forecast table can be very simple:
| Month | Actual Revenue | Baseline Forecast | Conservative Forecast | Optimistic Forecast | Notes |
|---|---|---|---|---|---|
| Jan 2026 | $50,000 | $47,500 | $54,000 | Normal month expected | |
| Feb 2026 | $51,000 | $48,000 | $55,500 | Short month | |
| Mar 2026 | $53,000 | $49,500 | $58,000 | Planned ad campaign |
Do not bury your assumptions on a hidden tab. Put them somewhere the owner, manager, or bookkeeper can review easily.
Limitations: When ChatGPT and Google Sheets Won’t Be Enough
ChatGPT and Google Sheets can be useful, but they are not magic. They are tools for organizing thinking, not replacements for business judgment.
ChatGPT Can Make Mistakes
ChatGPT can explain formulas, suggest forecast structures, and summarize trends. It can also choose weak assumptions, misunderstand messy data, or produce formulas that need adjustment. Always review the logic before using the forecast for important decisions.
Google Sheets Can Become Fragile
Google Sheets is flexible, but that flexibility can create problems. Multiple people may overwrite formulas, import data inconsistently, rename tabs, or accidentally break charts. As the forecast becomes more important, protect key ranges and document the workflow.
Incomplete Data Creates Weak Forecasts
Forecasts are less reliable when sales data is incomplete, highly seasonal, or driven by one-off deals. A business that closes five large contracts per year needs a different forecasting approach than a business with hundreds of small monthly transactions.
It Is Not a Replacement for Professional Advice
This workflow is not a replacement for a bookkeeper, accountant, CFO, financial advisor, or dedicated forecasting system. Use it as a practical planning tool, then involve qualified professionals when decisions affect taxes, financing, investor reporting, payroll commitments, or major capital spending.
When to Consider Better Systems
Growing teams may eventually need CRM-connected forecasting through tools such as HubSpot, Pipedrive, Salesforce, Cube, or a custom dashboard. These systems can make sense when you need live CRM data, automated alerts, role-based access, approval workflows, or repeatable monthly reporting.
| Approach | Rough Cost | Ease of Use | Best Fit |
|---|---|---|---|
| Google Sheets + ChatGPT | Free to low monthly cost | Easy to moderate | Small teams building a first practical forecast |
| CRM Forecasting | Varies by platform and seats | Moderate | Teams with active deal pipelines and sales reps |
| Dedicated Forecasting Software | Often higher monthly or annual cost | Moderate to advanced | Companies needing governed planning and reporting |
| Custom Dashboard or Automation | Project-based or ongoing support | Depends on design | Businesses with repeatable reporting needs across tools |
Next Step: Build a Small Forecast You Can Actually Use
Start with one forecast goal. For most small businesses, forecasting next quarter’s revenue is more useful than trying to model the entire company at once.
Use the last 12 months of sales data, one baseline growth assumption, and one conservative scenario. Then review the forecast monthly. Compare actual revenue against projected revenue and write down why the numbers were different.
After that, improve one part at a time. Add lead source tracking. Add average deal size. Add close rate by channel. Add seasonality notes. The forecast will become more useful as the inputs become more accurate.
For more related planning topics, see McCary Group resources on ChatGPT for small business, AI automation, data strategy, and measuring automation ROI.
If your spreadsheet becomes too manual, breaks often, or takes hours to update each month, that is usually the signal to consider a lightweight custom automation or consulting review before buying expensive software. A simple forecast is valuable only if your team can maintain it and trust it.